*Disclaimer: results of this survey are reported with integers. While it is possible to assign characters to visually identify the specific values, integers were selected for their use in statistical analysis.
Introduction
Plant based milk alternatives have become a grocery staple for many Americans in recent years. Statista reports revenue growth for the milk substitutes market skyrocketing over 2020 and steadying out over 2022 and 2023.
I represent a new plant based milk alternative brand trying to enter the saturated market called “MilkJoy.” MilkJoy is trying to carve out a niche in the market and enlisted my help to better understand consumers in this sector.
I am interested in understanding the existing consumers in the plant based milk industry. I want to deeply understand their behaviors, characteristics, and tendencies in order to help MilkJoy understand how they can best serve consumers’ needs with their product.
I plan to examine consumers’ level of satisfaction with their current milk-alternative brand to make sense of the behaviors and attitudes of loyal users (i.e., why do they choose particular brands and what prompts them to repurchase), in order to develop a set of recommendations for MilkJoy to improve their business and marketing efforts and encourage people to switch to their brand.
The Plan – Survey Building
In order to better understand the behaviors and attitudes of milk substitute drinkers, I decided to go right to the source. Utilizing Qualtrics, a survey and reporting platform, I created a survey asking respondents about their experience buying and drinking plant based milk alternatives.
I started my survey with a few screening questions – essentially a few questions that will identify who is eligible to participate in the study (i.e., “Do you drink a plant based milk alternative?”) and classify them based on a few criteria (i.e., “What type of plant based milk alternative do you prefer/use? [Almond, Oat, Coconut, Soy, Cashew, Other]” and “What brand do you use?” [Blue Diamond, Almond Breeze, Silk, Califia Farms, Oatley, Other]). I also included two demographic related questions to better understand the characteristics of respondents (i.e., “What is your gender? [Male, Female, Other]” and “What is your age? [Open response]”).
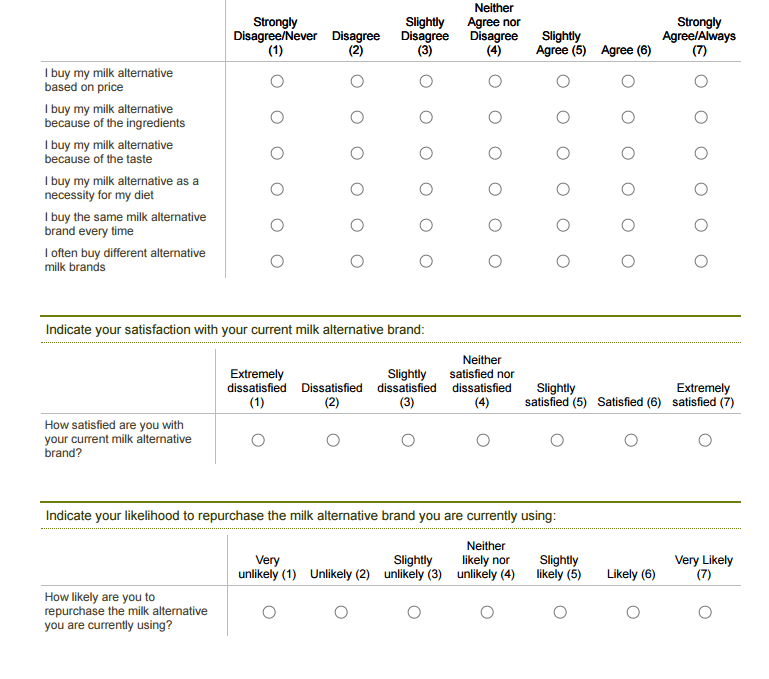
Next I focused on the product; why are people purchasing their milk alternative? Utilizing a Likert Scale to quantify attitudes and behaviors, I asked a series of questions on a scale of 1-7 and I inquired to consumers level of satisfaction with their current milk alternative brand:
I sent out the survey via an online link to students at Portland State University to gather intel about college students’ milk preferences. (MilkJoy had previously identified “college-aged” consumers as a target demographic they were interested in pursuing).
The Results
After a month of collecting information, I closed the survey to assess the results. In total, we received 121 responses, though there were a few responses with completely blank answers. So, after omitting those, we have a total survey cache of 102 respondents. (While this is generally a pretty low sample size which could lead to some biases, I continued ahead with my analysis.)
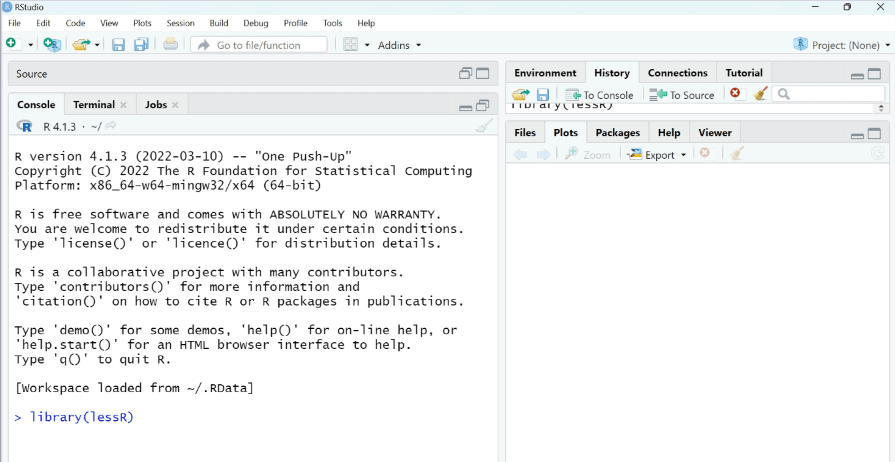
To conduct this analysis, I utilized “R,” a programming language for statistical computing and data visualization. I am utilizing the “lessR” package for this project – an R language aimed at creating a user-friendly statistical software experience (developed by David Gerbing at Portland State University).
First I load the lessR library and read my data (results from the survey populated in a .csv file) into R.
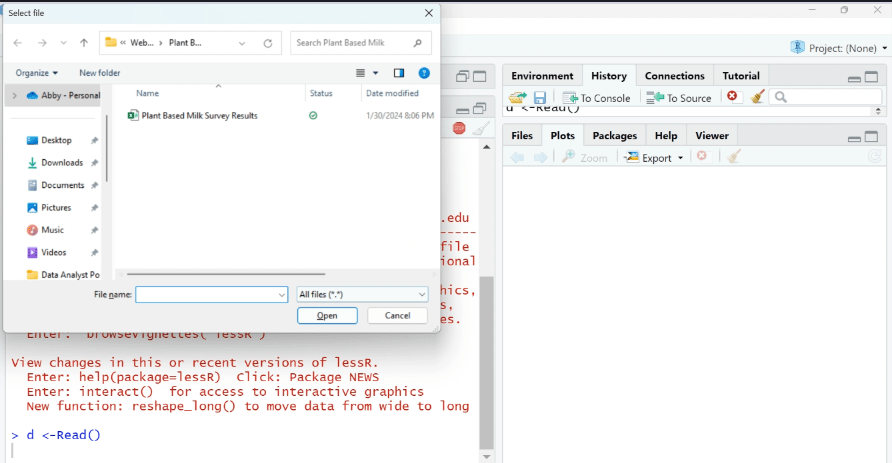
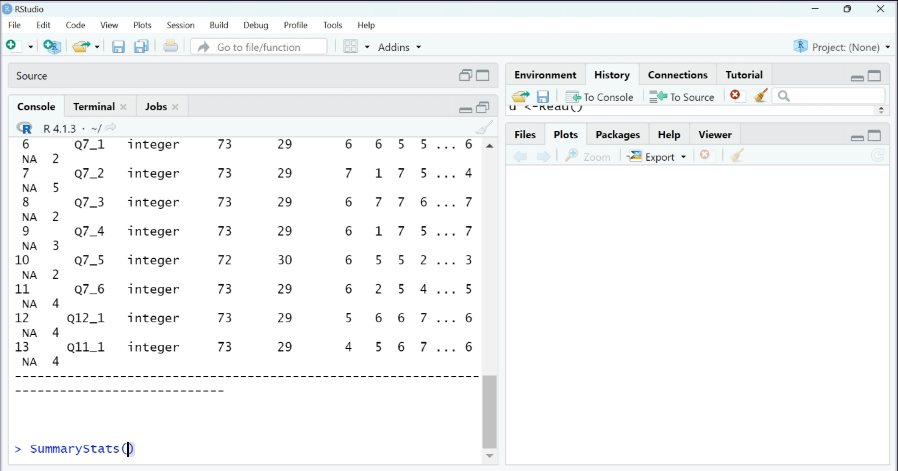
The output is a data frame detailing the questions organized Q1-Q12, type of data recorded, the total number of values, any missing or unique values, and a display of first and last values.
First I want to examine the results of the qualifying questions:
- Q1 – “Do you drink a plant based milk alternative?”
- Q2 – “What type of plant based milk alternative do you use? [Almond, Oat, Coconut, Soy, Cashew, Other]”
- Q3 – “What brand do you use? [Blue Diamond, Silk, Almond Breeze, Califia Farms, Oatley, Other].”
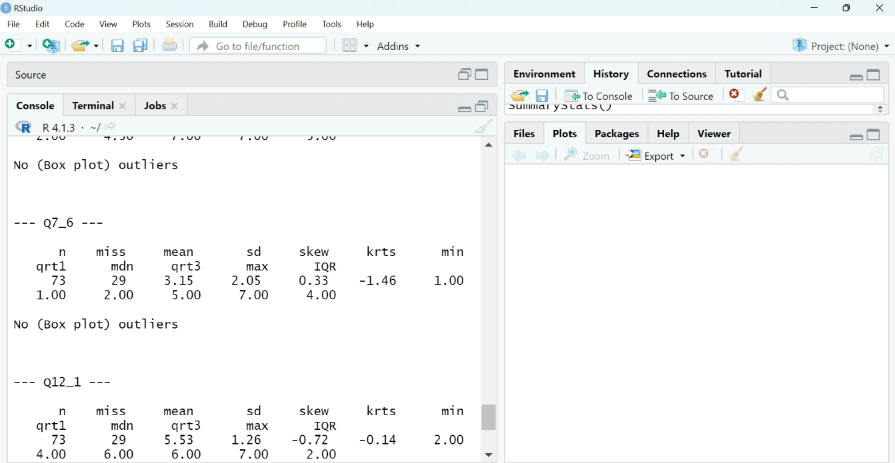
It’s pretty easy to pull some summary stats of a set of data in lessR:
However, looking at a numeric output for 11 questions can be a bit taxing on the brain. But luckily we can easily make it much easier to see visually.
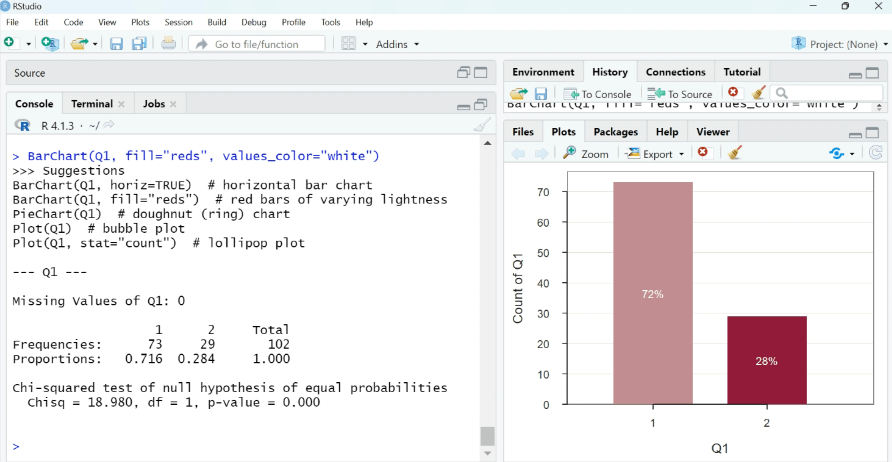
Great! Now we can gain a little more understanding of the people who took the survey.
Q1: Do you drink a plant based milk alternative? (1=Yes, 2=No)
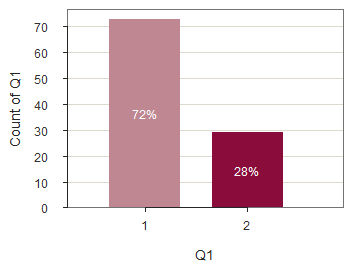
72% of people who took the survey suggested they do drink a plant based milk alternative and 28% did not.(If respondents answered no to this question the survey was ended and they were not able to proceed with the questions.)
Q2: What type of plant based milk alternative do you use? [1=Almond, 2=Oat, 3=Coconut, 4=Soy, 5=Cashew, 6=Other].
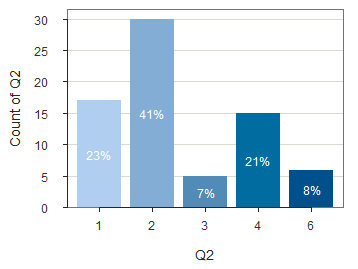
The majority of respondents drink oat milk at 41%, while a combination of almond and soy drinkers make up about 44%. Only 7% of respondents drink Coconut milk and no respondents drink cashew milk.
Q3: What brand do you use? [1=Blue Diamond, 2=Silk, 3=Almond Breeze, 4=Califia Farms, 5=Oatley, 6=Other].
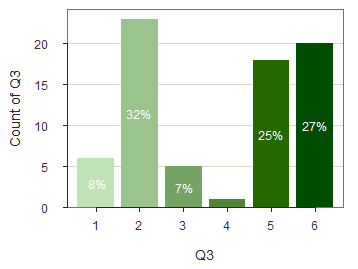
Respondents indicated that the most frequently bought milk substitute brand is Silk at 32%, followed closely by a brand not listed (option 6) at 27%, and Oatley at 25%. The least purchased brand is Califia Farms at less than 5%.
Now we have an idea of who is taking this survey. Most of the respondents who drink a plant based milk alternative (72%) drink oat, almond, or soy milk and tend to buy Silk and Oatley. We will learn the most about these specific milk alternative drinkers and their behaviors and attitudes.
Next we can examine more demographic information about the respondents:
Q4: What is your gender? (1=Male, 2=Female, 3=Other).
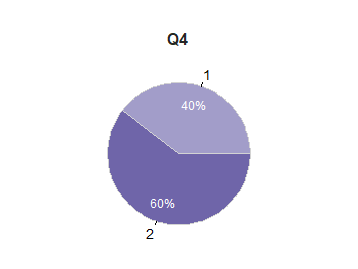
60% of respondents are female, while 40% is male.
Q6: How old are you? (Responses vary).
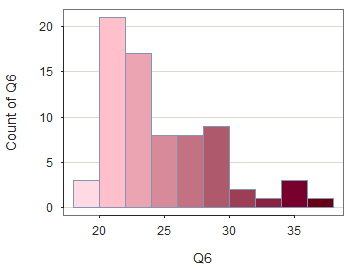
The age range for respondents varies from 19-37 years old. On average, respondents are about 25 years old.
Now let’s draw some inferences between the qualifying questions and demographic information.
What are the differences or similarities between men and women in relation to the type of plant milk they drink?
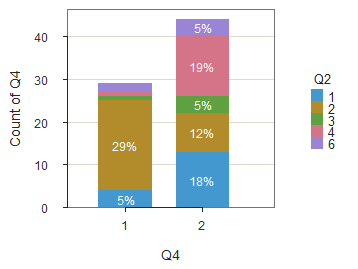
More than 70% of male respondents indicated they drink oat milk, accounting for 29% of total respondents. Female respondents had more distribution with nearly 30% drinking almond milk (18% total) and nearly 30% drinking soy milk (19% total). Also, there was a strong population of oat milk drinks at 20% (12% overall).
This information could suggest that women are more flexible in the type of plant based milk they drink compared to men who seem to have a strong preference for oat milk.
Next, let’s look at the preferences of men and women in relation to brand.
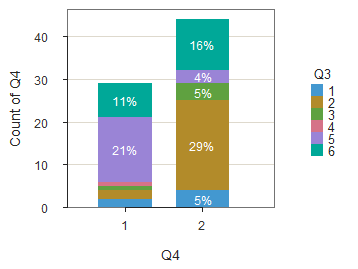
51% of male respondents use Oatley (21% overall), and about 27% (11% overall) use a brand not listed. Women, again, have much more variation in their brand preferences, with 47% (29% overall) using Silk, 27% (16% overall) using a brand not listed, and a combined 18% (10% overall) using Blue Diamond and Almond Breeze.
The results of this inquiry suggest that there may be another brand out there that was not listed that is worth investigating further. Or it could indicate that there are various other brands with equally as infrequently purchased scattered amongst the saturated market.
Next we will take a look at the results of the product attribute responses:
*These questions were assessed on a scale of 1-7, where 1 is strongly disagree and 7 is strongly agree.
Q7_1: I buy my milk alternative based on price.
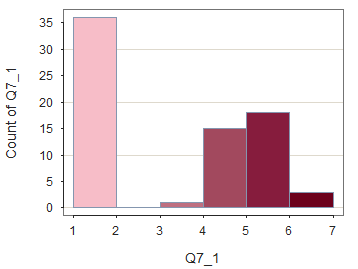
There is a strong skewness towards the left of the results, indicating a significant disagreeance with the prompt. However there is also a strong concentration of agreeance with “Slightly Agree” & Agree.” There is not an overwhelming truth to be derived from this output. However, when examined through the lens of gender a bit of a clearer pattern emerges.
There is a relatively equal distribution who indicated that they disagree they buy their milk alternative based on price. However, nearly double the amount of women compared to men responded in the positive. (Are women more cost conscious?)
Q7_2: I buy my milk alternative because of the ingredients.

There is also a bit of variation in the results of this question. There is a strong concentration in the middle of the distribution, indicating some level of indifference. However, both ends are also significantly prominent. There does not appear to be a significant correlation between purchasing a milk alternative and the ingredients in the milk.
Q7_3: I buy my milk alternative because of the taste.
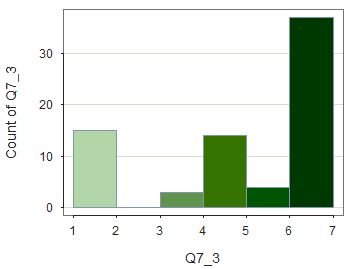
There appears to be a strong rightward skewness, indicating that many respondents are in agreeance with the prompt that they buy their milk alternative because of its taste.
Q7_4: I buy my milk alternative as a necessity for my diet.
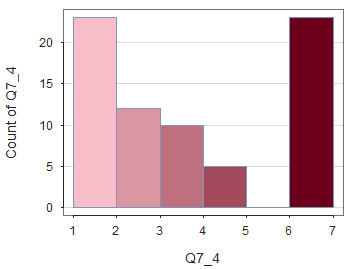
The results display a general leftward skewness, suggesting that respondents tend to disagree with the prompt “I buy my milk alternative as a necessity for my diet.” However there is a strong showing at the “Strongly Agree” section. This does logically make sense, considering some people do have to drink a milk alternative as a necessity for their diet.
Q7_5: I buy the same milk alternative brand every time.
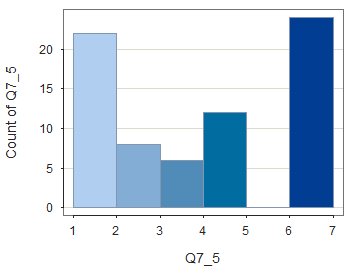
The results indicate somewhat of a leftward skewness, indicating general disagreeance with the prompt. However there is a significant population in complete agreeance with the prompt – these are the uber loyal customers who buy the same brand every time.
These are not the customers we are trying to attain. If anything, the results of this question solidifies MilkJoy’s decision to pursue consumers in this category, i.e., people generally indicated they do not buy the same milk alternative brand every time, suggesting they are open to trying new brands.
Q7_6: I often buy different milk alternative brands.
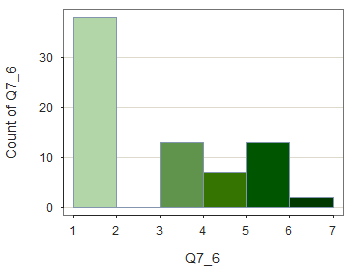
The results indicate somewhat rightward skewness, indicating general agreeance with the prompt. However there is a significant population in complete disagreeance with the prompt – these are the loyal customers identified in the previous question who only buy one brand.
Again, this question strengthens MilkJoy’s pursuance of a position in this market because of consumers continued willingness to try new brands.
And finally, the results of the “outcome variable;” the questions that indicate consumers’ level of satisfaction with their current milk alternative brand.
Q12_1: How satisfied are you with your current milk alternative brand?
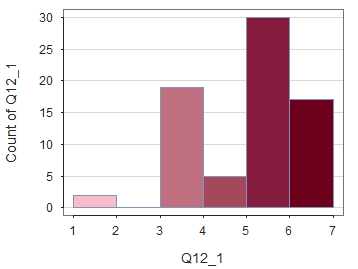
The results of this question display a somewhat right skewness, indicating a level of satisfaction with the prompt. However, the results are not unanimous, suggesting that consumers are not fully satisfied with what their current milk alternative brand has to offer.
Q11_1: How likely are you to repurchase the milk alternative you are currently using?
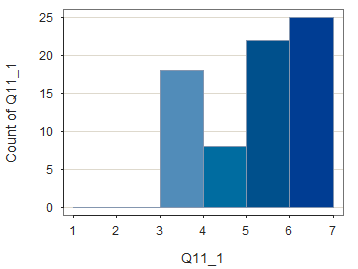
There is a strong rightward skewness, suggesting that most people are likely to repurchase their current milk alternative. However there are many factors that influence reciprocity, one being familiarity or safety. However, this does not indicate that consumers are not willing to purchase a new brand, simply that they are comfortable making this simple choice to repurchase. If MilkJoy wants to gain consumers attention and encourage switching, they have to deliver a strategy that makes purchasing an unknown brand an easy choice.
Statistical Analysis
Raw results of the survey gave us some foundations for drawing conclusions and making recommendations but a few key pieces of information may reveal deeper insights with further investigation. Particularly, assessing the relationship between gender and consumers likelihood to repurchase their current milk alternative brand is of interest. There did appear to be some distinct differences between men and women’s purchasing and taste preferences based on the raw results. If we can identify a target audience that is less likely to repurchase their current milk alternative brand, we may find a pocket in the market that MilkJoy can step into and grow an audience.
Mean Difference
A mean difference analysis compares a shared variable between two groups, typically a grouping variable (in this case gender) and a response variable (consumers likelihood to repurchase their milk alternative brand).
For instance, the mean difference between men and women’s likelihood to repurchase could look something like this:
Normality Assumption: Because the sample sizes are larger than 30, we can assume that if the distribution for the likelihood of respondents to repurchase their current milk alternative brand is normal, the mean difference may be normal. We can assume a 95% range of variation for the normal curve.
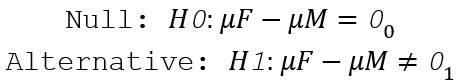
Hypothesis Test
For this analysis, we will assume that there is no difference between male and female respondent’s likelihood to repurchase their current milk alternative where, M=Male and F=Female.
Here’s the resulting “ttest” from R:
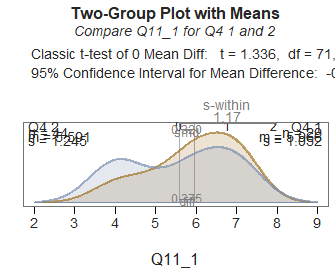
If the null hypothesis, that there is no difference between male and female respondent’s likelihood to repurchase their current brand is assumed true, the probability of obtaining a sample mean difference in either direction from the assumed value of zero (no difference) is (0.186)
If we adopt the criterion of 5% probability, the alpha probability that defines an unlikely event given our assumption of the null hypothesis, the p-value (0.186) is larger than the assumed value which indicates that a likely event occurred.
p-value=0.186 > a=0.05
In this case, we fail to reject the null hypothesis (that there is no difference in the sample means of male and female respondents’ likelihood to repurchase their current brand) as we are unable to detect a difference in the sample means.
Confidence Interval
The confidence interval estimates the unknown population mean difference of the likelihood of respondents to repurchase their current milk alternative brand between genders, i.e., this will indicate if we can extend the results of this sample data to a larger group of people. If there is a difference detected in the hypothesis test, then the confidence interval will determine how large the difference is.
(Note that there was not a difference detected in the above hypothesis test, but, for completeness a confidence interval test has been included).
With 95% confidence, the true mean difference of male and female respondents’ likelihood to repurchase their current milk alternative brand is, on average, anywhere from -0.185 to 0.934 points on the seven-point response scale.
Since zero is in the confidence interval, the two population means could plausibly equal each other, which supports our findings in the hypothesis test that there is no difference between the sample means.
Because there does not appear to be a difference between men and women’s likelihood to repurchase their current milk alternative brand based on this analysis, further research should be conducted before conclusions are drawn from the data.
Another potentially relevant piece of information that could be ascertained from this data is how taste affects consumers’ level of satisfaction with their current milk brand. A scatterplot is a great way to show the correction between an outcome variable like likelihood to repurchase and a product attribute such as taste.
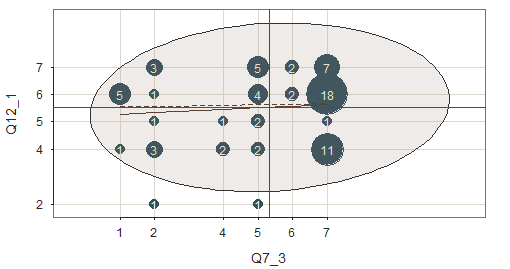
Satisfaction and taste (as a reason for purchase of a plant-based milk alternative, appears to be somewhat correlated. There is a slight upward trend – as the responses of purchase based on taste increase, there is also a slight increase in satisfaction, though the strength of that relationship does not appear to be overtly prominent.
Satisfaction Measured by Product Attributes
It’s important to understand the reasons consumers find satisfaction with their milk alternative brands, thus the results of the string of questions related to product attributes will be analyzed in relation to their level of satisfaction.
Multiple regression analysis is used to understand the relationship between an outcome variable and “predictor variables” (product attributes) as well as assists in forecasting unknown future variables.
Outcome Variable: Q12_1 “How satisfied are you with your current milk alternative brand?”
Predictor Variables:
- Q7_1 “I buy my milk alternative based on price.”
- Q7_2 “I buy my milk alternative because of the ingredients.”
- Q7_3 “I buy my milk alternative because of the taste.
The following scatterplot matrix shows the relationship of each of the predictor variables with the model with each other and the outcome variable.
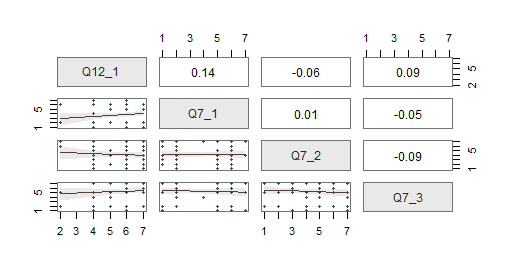
Q7_1 appears to have an upward sloping graph, suggesting a correlation to Q12_1.
Q7_2 is relatively horizontal, indicating no significant correlation to Q12_1.
Q7_3 is sloping slightly upward, though it does not appear to be strongly correlated to Q12_1.
The scatterplot matrix is reconfigured with additional predictor variables:
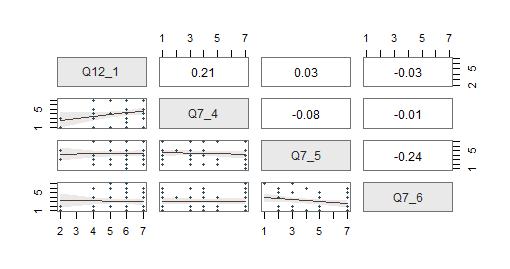
Q7_4 has an upward sloping graph, indicating a correlation to Q12_1.
Q7_5 is mostly horizontal, suggesting no significant correlation to Q12_1.
Q7_6 is also mostly horizontal, indicating no significant correlation to Q12_1.
The scatterplot is reconfigured with the most significant predictor variables Q7_1 and Q7_4:
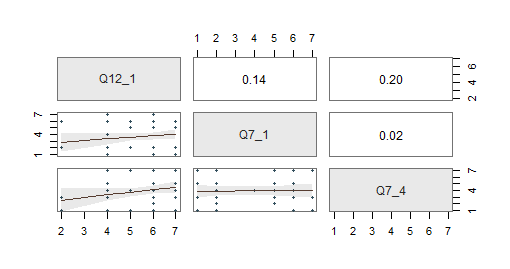
Q7_4 appears to be the most relevant variable, with the highest correlation with the target Q12_1 of 0.20, so it is the most likely predictor variable to remain in the final model.
The regression model describes this set of data:
Estimate Std Err t-value p-value Lower 95% Upper 95%
(Intercept) 4.480 0.537 8.344 0.000 3.409 5.552
Q7_1 0.087 0.071 1.223 0.226 -0.055 0.228
Q7_4 0.105 0.060 1.735 0.087 -0.016 0.226
Q7_3 0.060 0.069 0.875 0.385 -0.077 0.198
Hypothesis test for Q7_4 (Diet)
p-value=0.105 > alpha=0.05
Assuming the null hypothesis, that there is no relationship between the predictor and outcome variable, a likely event occurred, so we fail to reject the null hypothesis that there is no relationship between Satisfaction and Diet Necessity with the values of Price and Taste held the same.
Recommendations
Plant based milk drinks represent a steady population in the US. If MilkJoy wants to create a position in the saturated market, they need to understand their consumers, particularly their purchasing behaviors and attitudes.
*Note that the survey results represent a small portion of the population, but for the purposes of this exploration, I am developing recommendations assuming that the survey results are applicable to the entire subject population.
Key finding from this survey include:
- 41% of respondents drink oat milk.
- 32% of respondents purchase Silk.
- Men tend to be loyal to the type of milk they drink (i.e., Oat Milk) and the brand they purchase (Oatley), while women have much more variation in the types of milk they drink and brands they purchase.
- In general, respondents suggested they buy their milk alternative because of its taste.
- Overall disagreeance with the prompt “I buy the same milk alternative brand every time” indicates MilkJoy has an opportunity to enter the market and capitalize on consumers’ (specifically women as indicated in bullet #3) willingness to try new brands and types of milk alternatives.
- There does not appear to be a difference between men and women’s likelihood to repurchase their current milk alternative brand.
- There is a slight upward trend of taste being related to satisfaction with a milk alternative.
- Results of the multiple regression analysis did not find a predictor variable strongly correlated to satisfaction.
If MilkJoy intends to enter into the milk alternative market, here are a few product and marketing strategy recommendations to implement based on the results of this survey. (Note this is not a comprehensive strategic product or marketing plan, it is simply a few recommendations based on insights gained in the survey and analysis).
Product
Oat & Almond milk are the most sought after type of milk alternative. However, Soy milk holds a significant consumer population with fewer competitive brands. This may be a good entry point for MilkJoy to establish their brand with a specialized offering and expand their product line to Oat and Almond as they carve out a niche for themselves.
There appears to be some connection between taste and satisfaction – MilkJoy should focus efforts on creating a product that focuses on the taste. They should conduct further, more specific research on milk alternative taste and its connection to customer satisfaction.
Marketing
Results of the survey and analysis indicate MilkJoy should be targeting women in their marketing strategy – they are more willing to try new brands and types of milk alternatives compared to men who tended to remain loyal to the same type of milk and brand.
Results indicate consumers are likely to repurchase their current brand. This does pose some challenges for MilkJoy as it is difficult to change consumer behavior with a product that fulfills the same needs as a product that is already at their disposal. If MilkJoy wants to capture consumers’ attention and encourage them to try a new product, they must position themselves similarly (enough) to current leaders such as Silk and Oatley that consumers are not driven away by something vastly different, but with a key differentiator.
Results of this survey and analysis did not point to one obvious predictor variable related to customer satisfaction but MilkJoy could experiment with various differentiators such as price, a hyper-specific target audience, geographically focused selling, or positioning (“small-guy” / “best taste” / “lifestyle” / “relatable”, etc.).
