
A fictitious basketball league is looking to improve their data management. They want to keep track of player information as well as game stats. Utilizing a combination of Access and PowerBI, I developed a comprehensive data management and visualization system for the league.
Access Database
I began by developing the database in Access through various tables, queries, and forms. I loaded all the existing data into the database and created a user-friendly experience so users can easily navigate between team and game information.
Check out some of the databases key features:
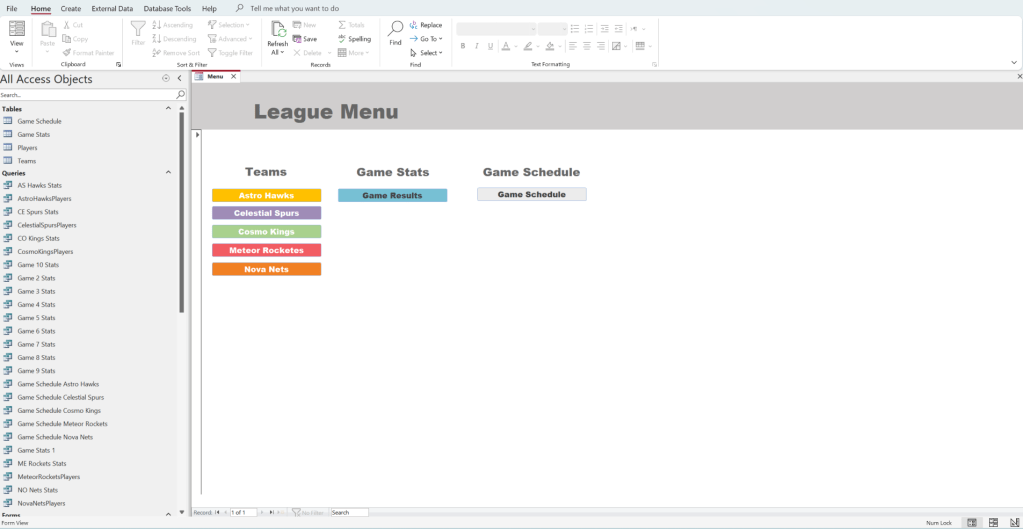
When the database is opened, it populates to the “League Menu Screen,” where users can navigate to a team’s homepage, game stats, or game schedule.
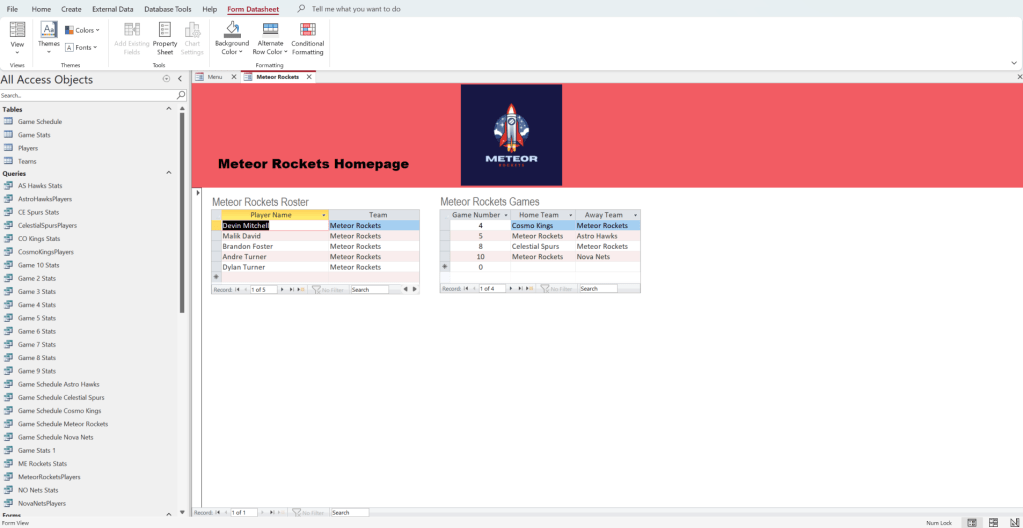
Each team’s homepage displays a roster and game schedule, and is branded.
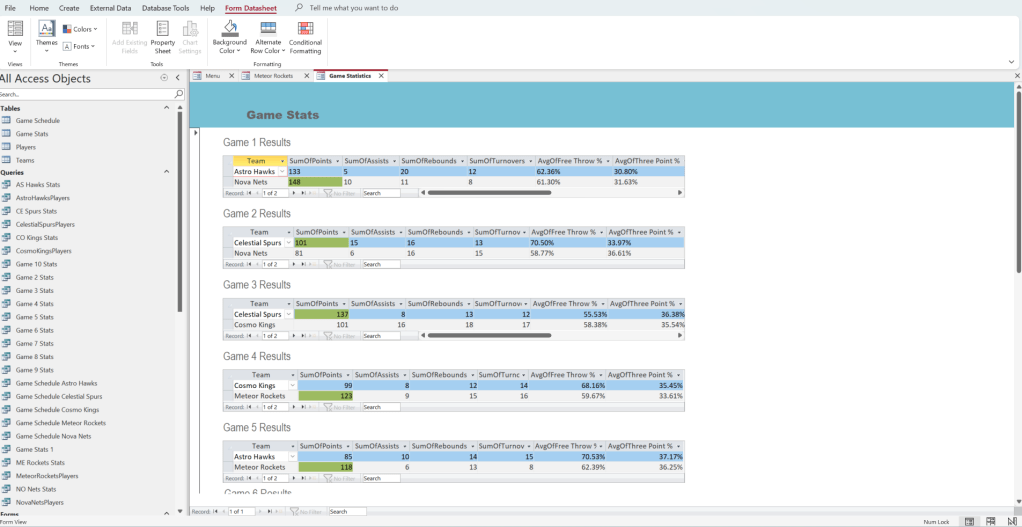
The “Game Statistics/Results” form is plays all the key stats from each game, noting the winner of the match.
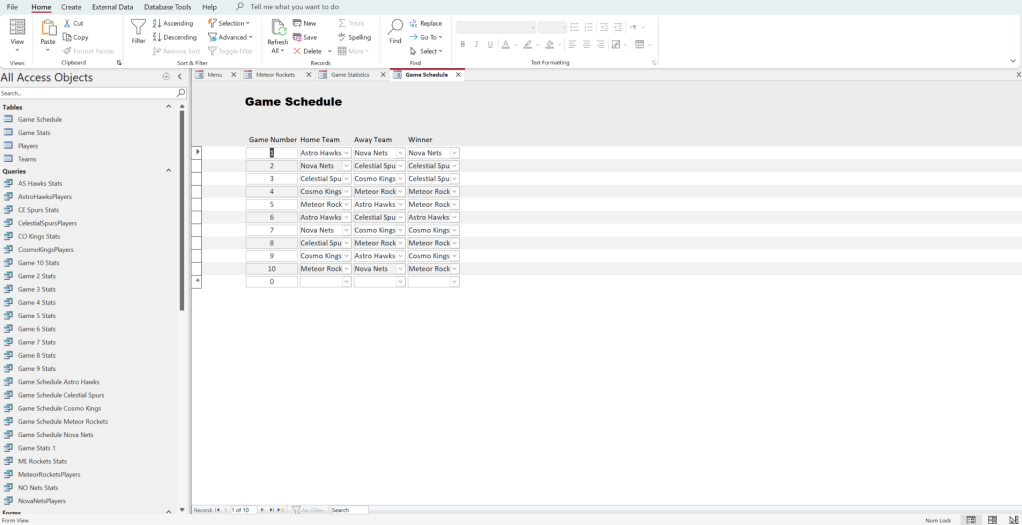
And finally, the “Game Schedule” button leads to a form that displays all of the leagues games.
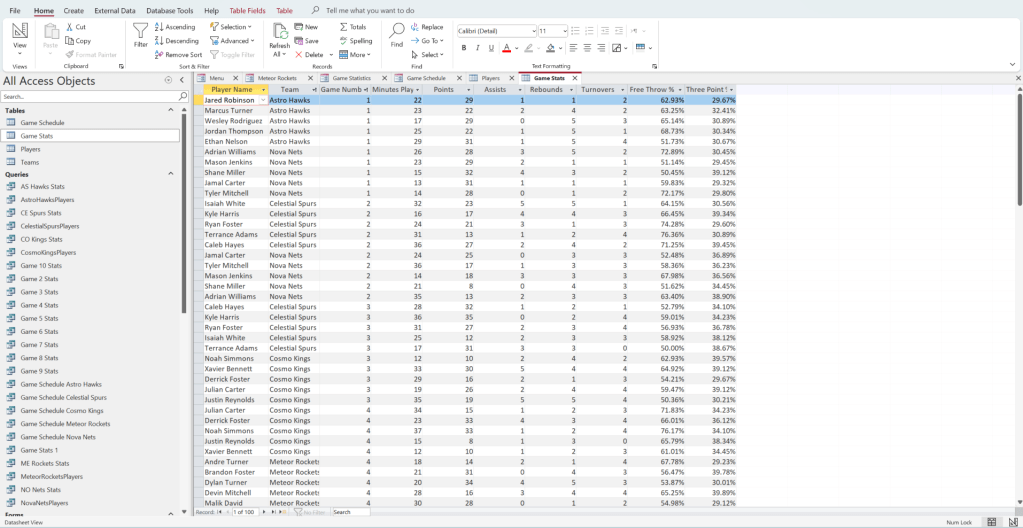
All of the forms that display the front end functions of this database are base on a variety of tables and queries. For instance, the “Player” and “Game Stats” tables are presented below.

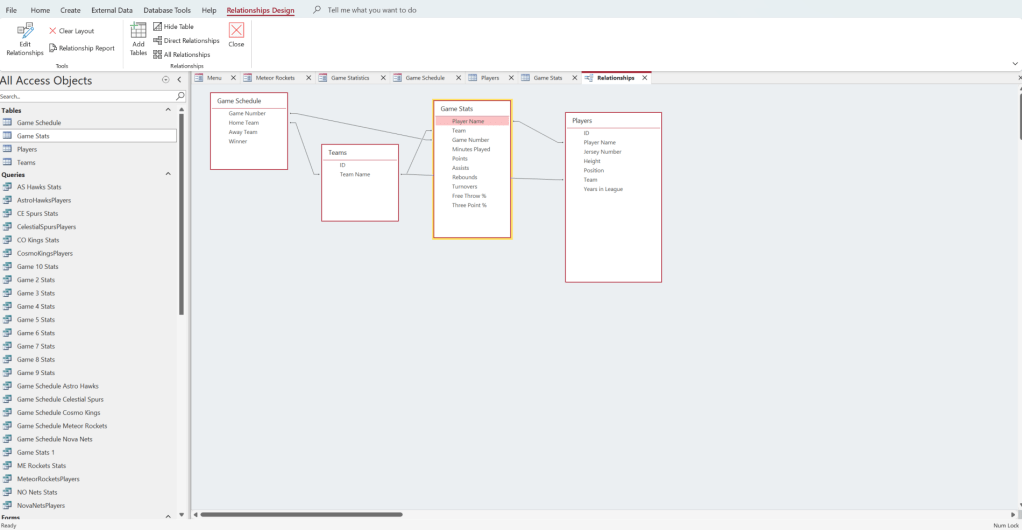
All of these tables and queries that support this database are tied together with various relationships:
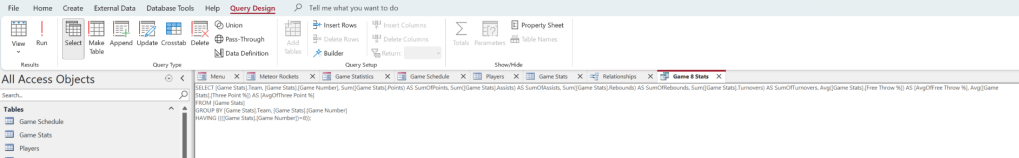
These relationships help support the writing of queries that allow me to make forms that display results of individual games:
PowerBI Dashboards
Once I had established a location to store the data, I was able to create interactive dashboards that quickly communicate key, relevant information about the league and individual players.
Check out the “Season Results” dashboard which displays the stats and results of all teams.
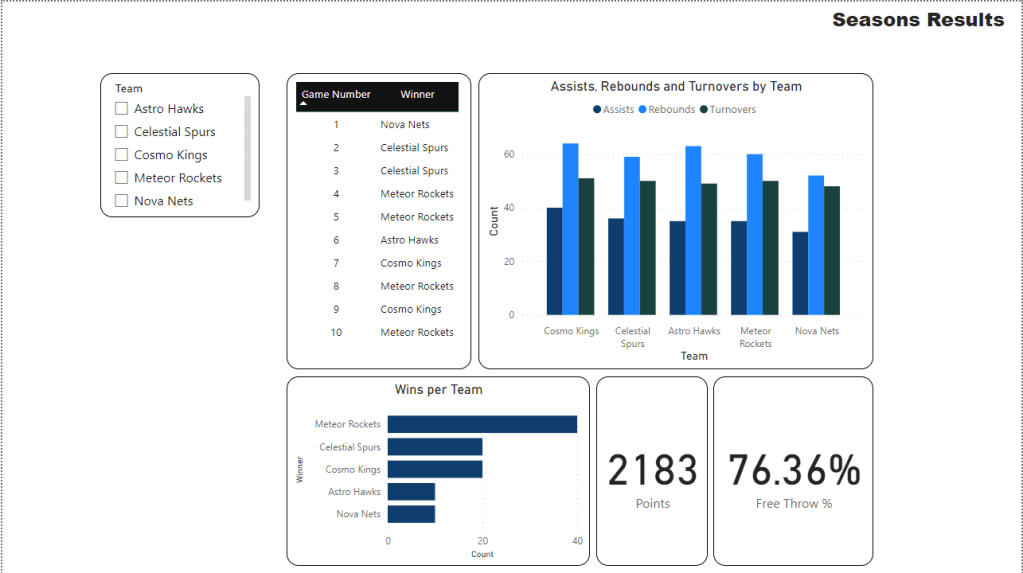
When a particular team is selected on the “Team” menu on the left, the report automatically adjusts results to only show for the selected team. For instance, check out the results for the Cosmo Kings.
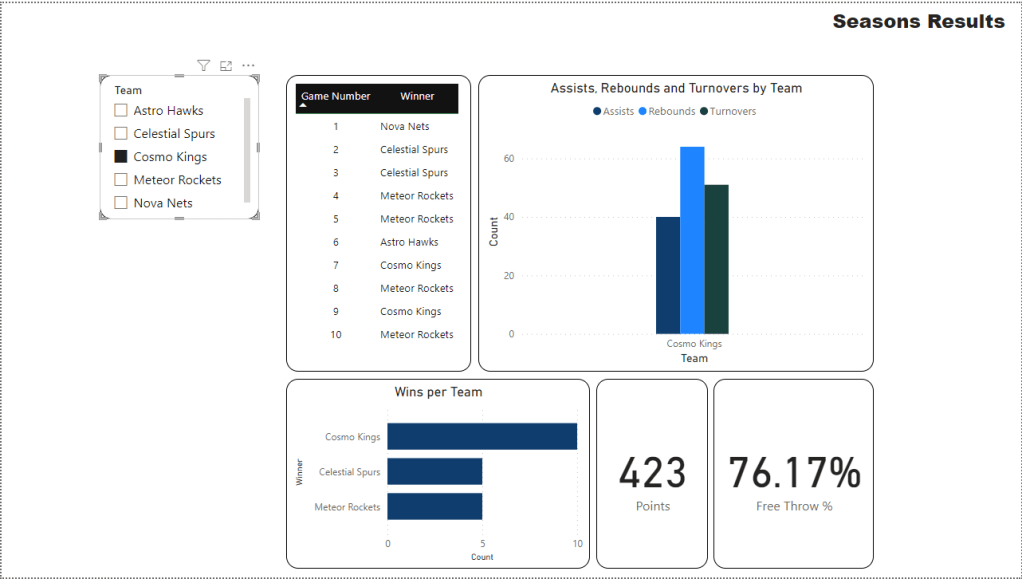
The quick and visually accessible nature of the dashboard makes it incredibly easy to gather a lot of valuable information in a short amount of time.
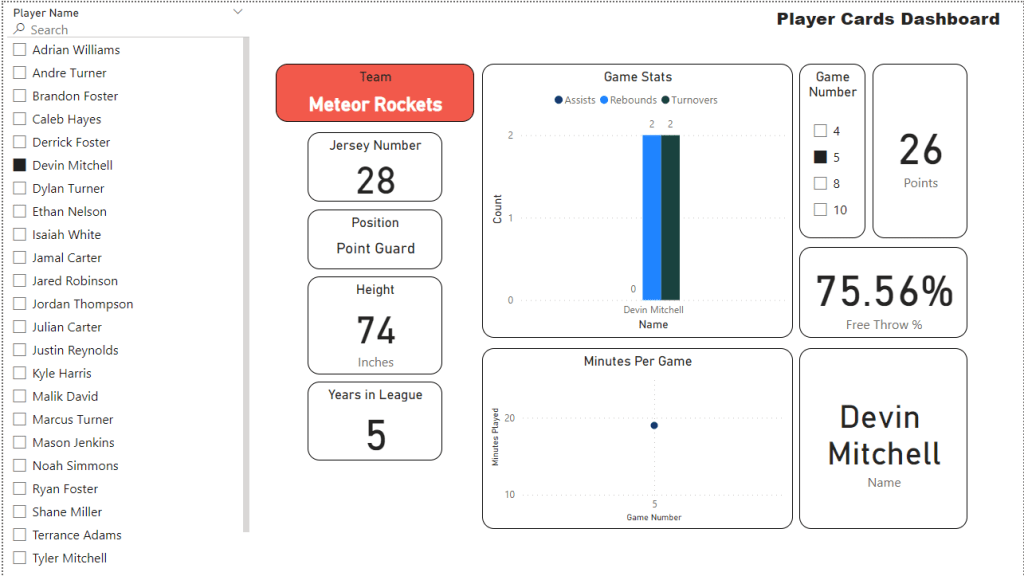
There is also a “Player Card” dashboard, which displayers key player information when their name is selected on the left hand menu.
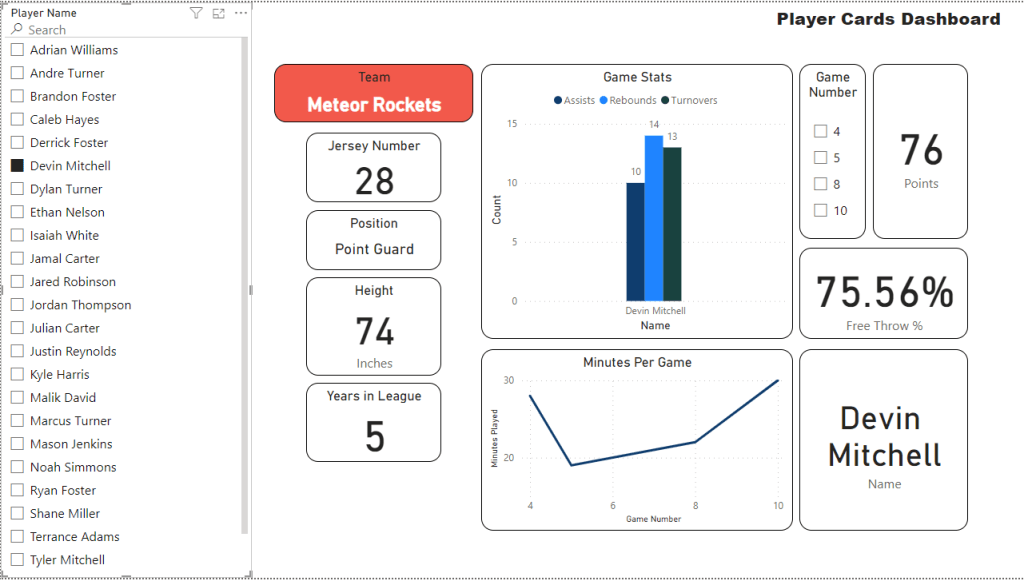
The dashboard also lets users select a specific game to display stats for, further narrowing in on key details.
Conclusion
This information gained through the use of Access and PowerBI is invaluable to the league and individual teams. While Access provides a simple structure to collect and store data, its visual appeal and ability to quickly communicate data are lacking. However, in combination with a PowerBI dashboard, the ability for the league and teams to access key information becomes incredibly easy paving the way for new insights to be gained.
